Report Designer Data Panel
The data panel within the Report Designer enables you to customize a report you created with the information you need. To navigate to this panel, select and then select Report Manager under Features. Click the drop-down icon to the left of the desired report and then select Design Report from the Record Options drop-down menu. If the report was created by Skyward, you must clone the report before you can access the Design Report option.
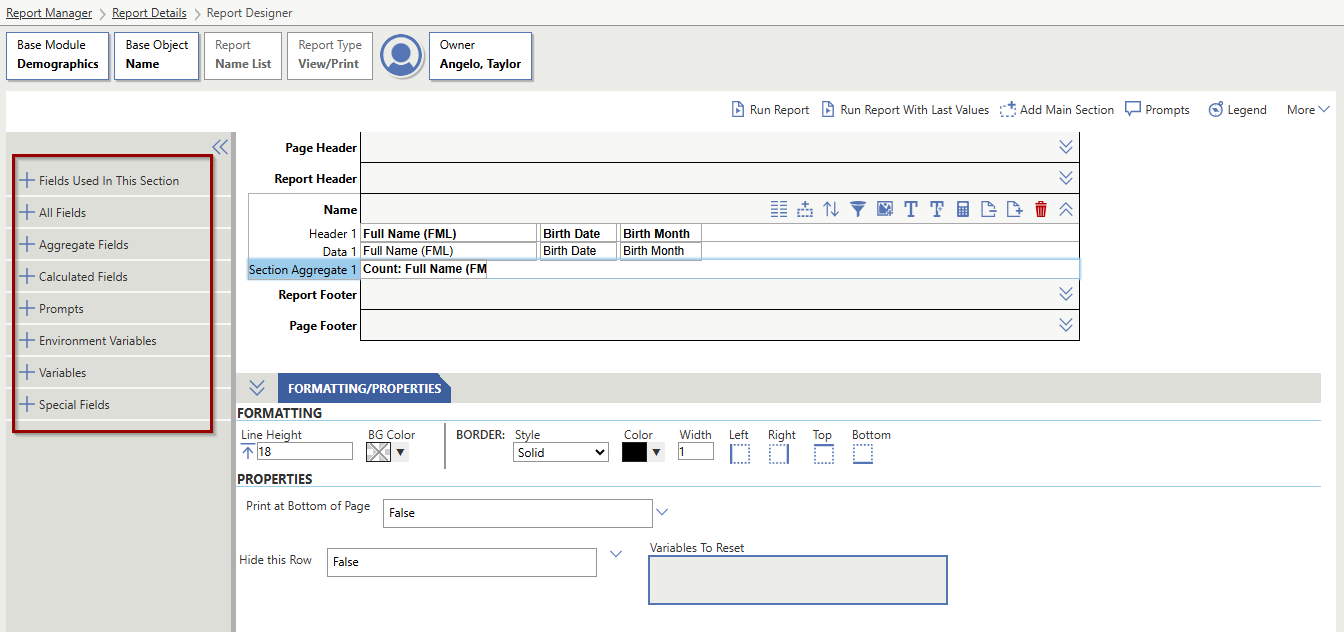
The image below outlines the data panel of the Report Designer, which displays the Fields, Calculated Fields, Prompts, Environment Variables, Variables, and Special Fields tabs for a report in the Demographics module.
| Tab | Description | Example |
|---|---|---|
| Fields | Contains all the fields you can include in your report based on the Base Module and Base Object selected. | If you are working within the Demographics module, you would see fields such as the Full Name, Birthdate, and Age. To the left of each field name is an icon, which indicates what type of field it is. |
| Aggregate Fields | Displays if a Section Aggregate Line or Totals Line is selected on the report. This tab contains fields that have already been added to the main section or details section of the report. | If you need to alleviate the need for building Calculated Fields or Aggregate Math Fields, aggregate fields contain aggregate types that can assist you with performing different operations such as concatenate, sum, count, and variance. |
| Calculated Fields | Enables you to build your own Calculated Field, which can be used to create calculations on existing fields, prompts, or environment variables. This functionality prevents you from having to perform calculations outside of the software. | You can perform tasks such as rounding, averaging, performing simple math, and creating conditionalized statements. |
| Prompts | Displays Prompts that you can add to a report. | You can use prompts to present users running the report with a series of questions, which help determine what data will be incorporated into the report. |
| Environment Variables | Displays fields that pull values from the session in the software at the time the report is run. | You could add the Selected District field to your report. When the report is run, it displays the ID of the district that was last selected in the top left corner of the screen. The Selected Numeric School Year will use the numeric value of the currently active school year even if you had a historic year selected last. However, Scheduled Reports will always use the active version of whatever was selected when it was scheduled. |
| Variables | Enables you to move data from one data section to another on the report. | You may use variables to pull totals from multiple main sections in order to create a summary of those totals on the last page of the report. |
| Special Fields | Displays fields that pull general information about the report at the time it is run. |
Depending on the type of line selected, you may see different fields available in this tab.
You could choose to place the District Name, Report Name, or Prompt Template Name in the Report Header Line of your report. Additionally, you could choose to place the Page Number and Total Page Number in the Page Footer line of your report.
|
| CSV/Delimited Properties | Displays if your report type is set to CSV/Delimited with a Delimited field and a Text Qualifier field. The Delimiter field defaults to a comma (,) and the Text Qualifier field defaults to a quotation mark ("), but you can adjust them as necessary. | If you need to upload a report to a third-party vendor site, and the delimiter and text qualifier need to be set to certain properties in order for the report to upload successfully, you can change these values. |
| XML Properties | Displays if your report type is set to XML with properties for Root Node, Root Node Name, and Row Name. The Root Node checkbox indicates whether the top-level node of the XML should display on the report. The Root Node Name is the name the root node will appear as on the report. The Row Name acts as a parent element for elements within that line and defaults to the name of the report line. |
If report line Data 1 is selected, the row name will default to Data 1. If the report has more than one main section, you will not be able to uncheck the Root Node box. |
You can also resize portions of the Report Designer. You can adjust the data panel at the left of the screen by clicking the right edge and moving it left or right. To collapse the panel, you can click the Double Left Arrows icon in the top right of the panel. You can then expand it by clicking the Double Right Arrows icon.