Creating Quick Report
Creating a quick report enables you to generate a report designer template from a browse screen in the software. If there is data on a screen you want to run a report for, the quick report is the fastest way to do so, as you will not need to search for fields and set filters like you would when creating a standard report. The information included on the browse screen automatically pulls on the report template as fields when you select this option. The filters and column totals set up on the browse screen are also automatically applied to the report. For example, you can generate a quick report from the Name List.
These instructions provide an example of creating a quick report from the Demographics module. However, quick reports can be created from any browse screen.
Scroll past the video to access the step-by-step instructions.
Audio Transcript
With the due dates for your reports crawling closer and closer, it may seem that time is working against you. Have no fear—you can create and print a quick report without sacrificing style and readability. We can create quick reports from most browse screens in the software. Quick reports can be easier to use than the standard report creation process, especially if you know how to modify the columns in a browse screen. For this example, we’ll head over to the Name List via the Demographics module. Sometimes there is more information on the screen than we need to print on the report. The Cog icon comes in handy for deleting the unnecessary columns for the report. Additionally, we can use the Cog to set a filter to exclude names marked as business. In this case, we'll select the option of False in the Filter By field, to exclude all names marked as business. Next, we’ll create the quick report. The columns from the previous screen automatically become data fields for our quick report, and the new filter we created appears here as well. Quick reports can also be run without making any changes on the previous screen, so since we didn't make any modifications, we'll select Run Report. From the View Report screen, we can save, download, or print our new report. Now that you know how to use the Quick Report feature, creating and printing a report in a short amount of time can be quick and easy.
With the due dates for your reports crawling closer and closer, it may seem that time is working against you. Have no fear—you can create and print a quick report without sacrificing style and readability. We can create quick reports from most browse screens in the software. Quick reports can be easier to use than the standard report creation process, especially if you know how to modify the columns in a browse screen. For this example, we’ll head over to the Name List via the Demographics module. Sometimes there is more information on the screen than we need to print on the report. The Cog icon comes in handy for deleting the unnecessary columns for the report. Additionally, we can use the Cog to set a filter to exclude names marked as business. In this case, we'll select the option of False in the Filter By field, to exclude all names marked as business. Next, we’ll create the quick report. The columns from the previous screen automatically become data fields for our quick report, and the new filter we created appears here as well. Quick reports can also be run without making any changes on the previous screen, so since we didn't make any modifications, we'll select Run Report. From the View Report screen, we can save, download, or print our new report. Now that you know how to use the Quick Report feature, creating and printing a report in a short amount of time can be quick and easy.
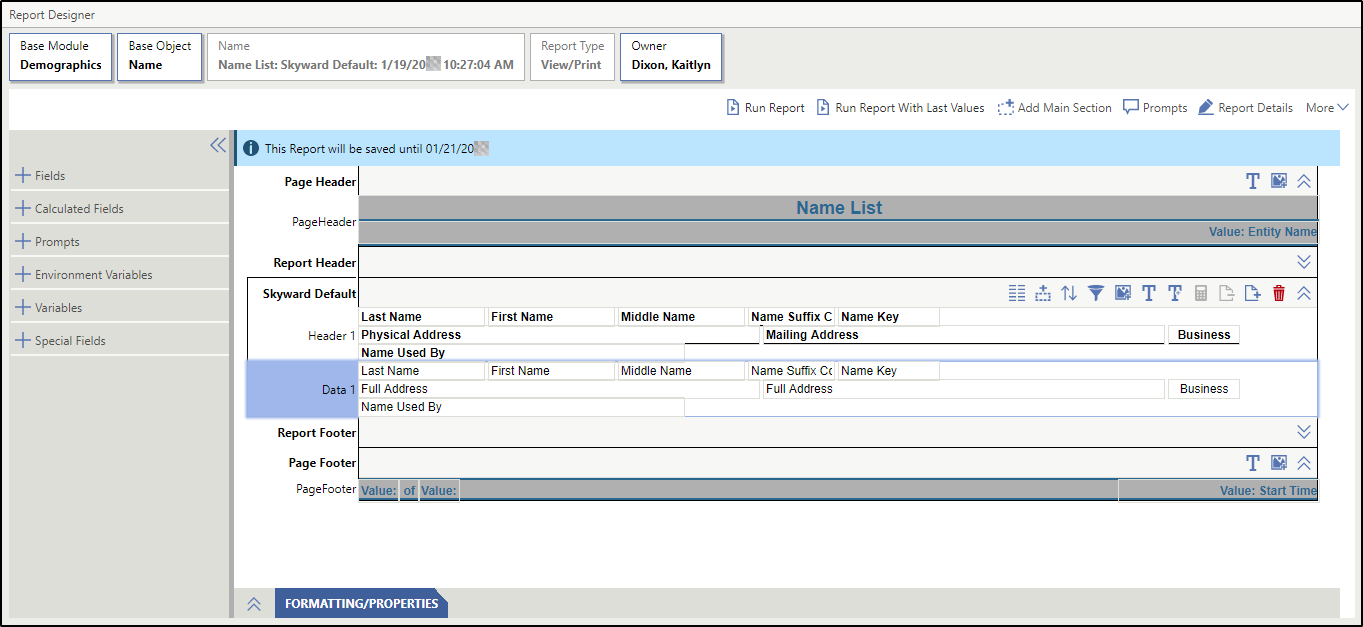
- Select Quick Report from the menu.
You can continue designing the report by adding fields within the header, footer, and report lines. Once you have added fields to the report, you can create filters to narrow the data included in the report.
This content will be covered later in this course.
-
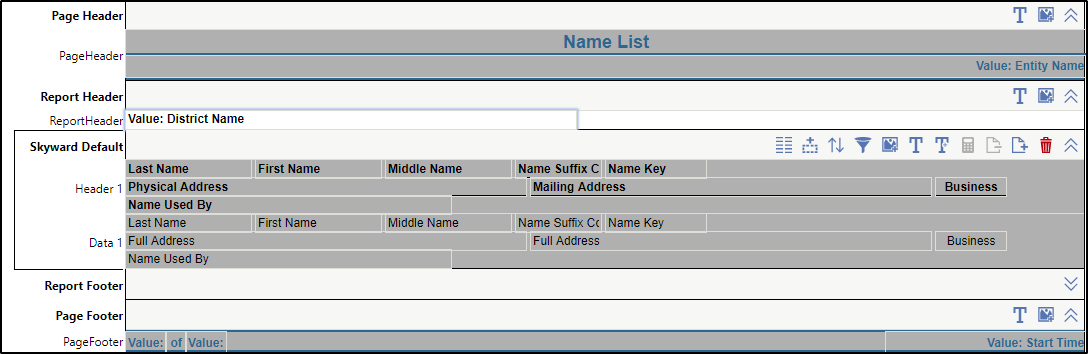
Select a field from the Special Fields or Environment Variables tabs to incorporate in your report header.
The image below displays the Report Designer at this point in the process. You see the District Name value has been added to the Report Header.
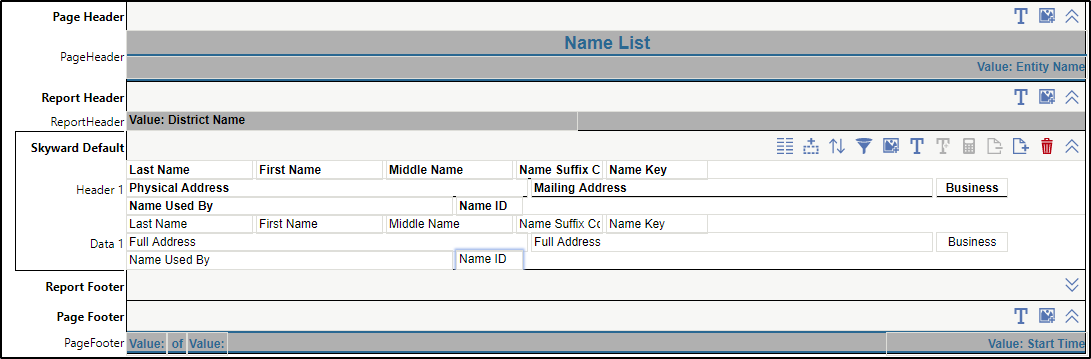
- Repeat steps 13 - 14 for each report line you wish to use in the main section of the report.
The image below displays the Report Designer at this point in the process. You see the Name ID field added to the Data 1 line of the main section of the report.
Result(s)
For more detailed information, please refer to the "Creating Quick Report" article in the Help Center.