Creating Reports
The Reporting module of the software enables you to design and use a variety of reports. You can create a report template, which includes the area of the software the data in the report is pulled from, as well as the report page format. You can continue designing the report by adding fields within the header, footer, and report data lines. You can also determine if a date needs to be entered in the Save Until field. If you enter a date in this field, the report will automatically be deleted on that date. When you are done setting up the report, you can save and run the report to view the information.
Multiple types of data can be included in the same report by later adding sections in the Report Designer. You are not limited to running a report on one base module and base object. Once the initial report template is completed, you can add other modules and objects to pull data from multiple areas of the software.
Scroll past the video to access the step-by-step instructions.
Audio Transcript
Do you need to create a report for your organization? For example, you may need to create one for a list of student activities. You can customize the look of your report and even add your own fields to it with the Report Designer! Let’s begin by heading to the Report Manager in the Reporting module. We can then add a new report. A name for the report will need to be specified. If necessary, a description can be entered to include additional information about the report. The Base Module and the Base Object allow us to identify the data we would like included on our report. For this example, we’ll choose Student. Since we are creating a report consisting of a list of students and their activities, we’ll choose Student. The Report Type defaults to View/Print. For this example, we can leave it as is. The Report Orientation, Page Size, and Margin default values will be used for this report. We can also include where the report will be available. This defaults to Administrative Access. Since this is the location we want to use for our report, we’ll leave it. If we wanted the system to automatically delete the report after a certain date, we could specify that here. Let’s click Save to continue the process. Back on the Report Designer, we can add specific fields to our report if needed. First, let’s include a Full Name. We’ll also want to add the Current Grade we want to include on the report. We need to include the field that indicates whether or not a student is currently active. We can see at the top of the list the fields specific to the current object we are in. The folders below allow us to pull from another object. We’ll use these folders to locate and add the field for the initial of the first name and the full last name of the students’ Homeroom Teacher. If we needed to change the name of a specific field, it’s as simple as clicking on the Header, and then entering the correct name into the field. We can do the same for the First Initial Last Name field to indicate that this field is to specify the Homeroom Teacher. Once we’ve verified all our information is correct, we can click Save & Run Report. On the View Report screen, we can see the report we just created. In the next video, we’ll go over modifying the report to include the students’ activities. Now that you’ve successfully created a report, you can be sure all of your information is accurate, and you can print your report!
Do you need to create a report for your organization? For example, you may need to create one for a list of student activities. You can customize the look of your report and even add your own fields to it with the Report Designer! Let’s begin by heading to the Report Manager in the Reporting module. We can then add a new report. A name for the report will need to be specified. If necessary, a description can be entered to include additional information about the report. The Base Module and the Base Object allow us to identify the data we would like included on our report. For this example, we’ll choose Student. Since we are creating a report consisting of a list of students and their activities, we’ll choose Student. The Report Type defaults to View/Print. For this example, we can leave it as is. The Report Orientation, Page Size, and Margin default values will be used for this report. We can also include where the report will be available. This defaults to Administrative Access. Since this is the location we want to use for our report, we’ll leave it. If we wanted the system to automatically delete the report after a certain date, we could specify that here. Let’s click Save to continue the process. Back on the Report Designer, we can add specific fields to our report if needed. First, let’s include a Full Name. We’ll also want to add the Current Grade we want to include on the report. We need to include the field that indicates whether or not a student is currently active. We can see at the top of the list the fields specific to the current object we are in. The folders below allow us to pull from another object. We’ll use these folders to locate and add the field for the initial of the first name and the full last name of the students’ Homeroom Teacher. If we needed to change the name of a specific field, it’s as simple as clicking on the Header, and then entering the correct name into the field. We can do the same for the First Initial Last Name field to indicate that this field is to specify the Homeroom Teacher. Once we’ve verified all our information is correct, we can click Save & Run Report. On the View Report screen, we can see the report we just created. In the next video, we’ll go over modifying the report to include the students’ activities. Now that you’ve successfully created a report, you can be sure all of your information is accurate, and you can print your report!
-
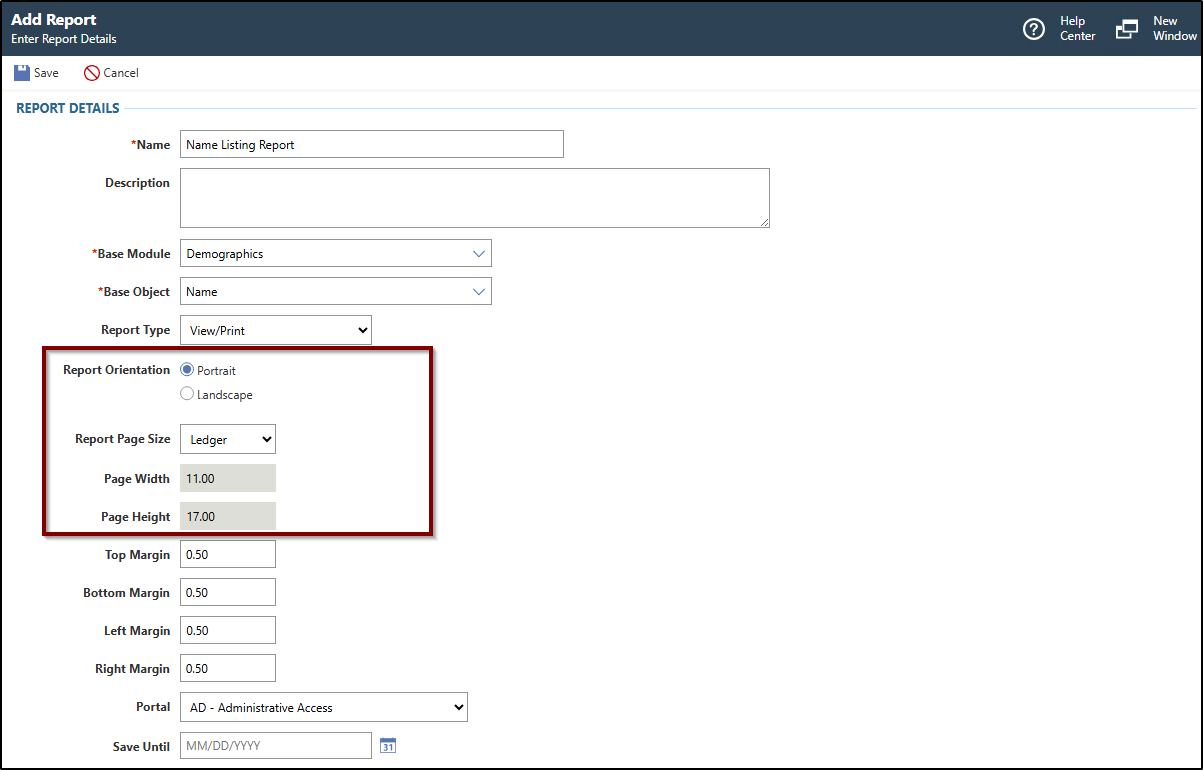
Complete the appropriate fields.
Required fields are identified with an asterisk. You must complete required fields before you can save your work.
-
Select the appropriate Report Page
Size from the drop-down list.
Once you make a selection, the Page Width and Page Height fields adjust automatically. For example, in the image below, with the Landscape report orientation and Ledger report page size selected, the Page Width defaults to 17.00 and the Page Height defaults to 11.00.
The measurement unit appears in inches.
-
Select the appropriate Report Page
Size from the drop-down list.
-
Select the field that you would like to incorporate by either double-clicking the field or clicking and dragging the field onto the report.
Fields marked with an asterisk indicate the field is calculated for you based upon other values within the system.
The table below explains the field types available for selection onto the report.
Icon Definition Calendar 31 The calendar icon represents a date field. Checkbox The check icon represents a checkbox. Folder The folder icon represents a folder, in which more fields and folders are available. Pound The pound icon represents a numeric field. Text The text icon represents a text-based field, typically a sequence of characters. This field type can consist purely of numbers, such as a social security number. Timespan The timespan icon represents a duration field, such as time. Three Columns The column group icon represents a single field that pulls multiple columns of information based on the logic assigned to the field. You can repeat the process until all fields needed in the data line have been added.
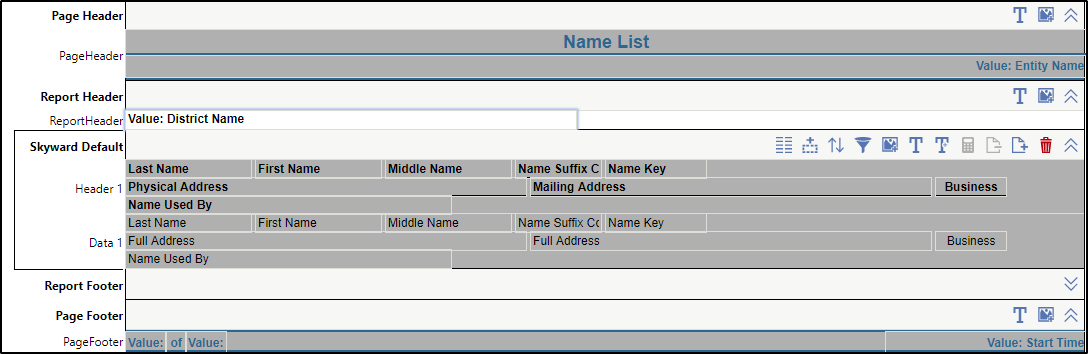
The image below displays the Report Designer at this point in the process. You see the District Name value has been added to the Report Header.
Result(s)
For more detailed information, please refer to the "Creating Reports" article in the Help Center.